We use the phrase business process to define a particular set of tasks or actions undertaken by an organization, that lead to the production of goods or services for the customer base. It's a flexible term — one that can be used to describe the most menial or idiosyncratic of assignments, or as a way of describing a company in its entirety.
Critical study of each facet of a process is imperative for maintaining high standards within a company, and to allow management to spot any flaws or inefficiencies in its day-to-day business. The most common way of condensing a process down into an organized format is to use a visual solution — one that allows each point to be represented clearly and succinctly, giving those that are unfamiliar with the process an unambiguous interpretation of events.
To support this visual style of quality management, a number of transferable methodologies have been developed — generic diagramming solutions that act as a framework around which unique and disparate processes can be formed. The collective term for this practice is business process mapping, and here follows a brief description of some of the more popular approaches to it.

A SIPOC diagram created with ConceptDraw PRO, showing all elements involved in hiring a candidate

Flowcharts show repeated processes, like this sequence of doctor appointment procedure

This swimlane diagram was created using ConceptDraw PRO, and shows the steps that each division is responsible for in a customer order
Critical study of each facet of a process is imperative for maintaining high standards within a company, and to allow management to spot any flaws or inefficiencies in its day-to-day business. The most common way of condensing a process down into an organized format is to use a visual solution — one that allows each point to be represented clearly and succinctly, giving those that are unfamiliar with the process an unambiguous interpretation of events.
To support this visual style of quality management, a number of transferable methodologies have been developed — generic diagramming solutions that act as a framework around which unique and disparate processes can be formed. The collective term for this practice is business process mapping, and here follows a brief description of some of the more popular approaches to it.
- SIPOC Diagrams — SIPOC stands for suppliers, inputs, process, outputs, and customers, and it is a style of diagram that has a clear focus on the quality of what is going in, and what is being produced from a business process. It has a simple visual form, a segmented table that produces comprehensive lists for each category. With a SIPOC diagram, the start and end of a process is clearly defined, and the relationship between a company and its external suppliers is easily identified. SIPOC diagrams form a key part of the Six Sigma methodology, which are a set of techniques and tools to help improve quality output and minimize variability within repeated tasks.
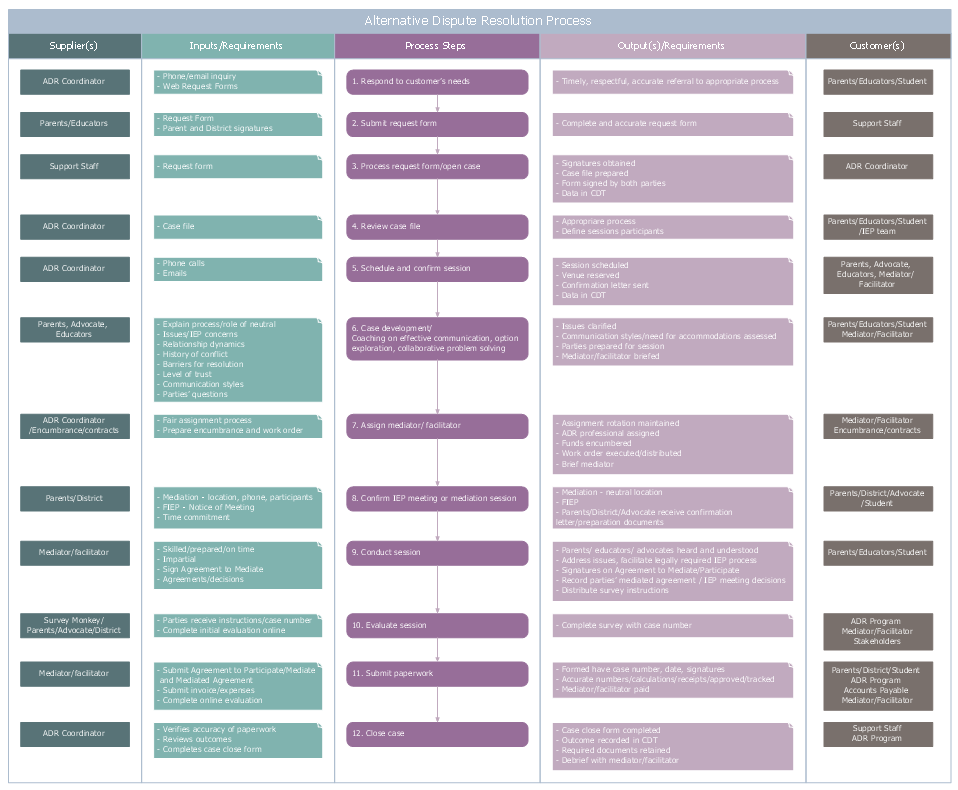
A SIPOC diagram created with ConceptDraw PRO, showing all elements involved in hiring a candidate
- Business process flowcharts — A flowchart is the go-to tool for representing any basic process that involves a series of steps or decisions, particularly processes that are repeatable. Also known as a process flow diagram, these charts act as a solution model to a given problem, telling the user exactly which steps can be taken at what time, and the impact of choices made within the workflow. As with SIPOC diagrams, a flowchart can show the input and output of materials and services in terms of the customer, as well as being used to define processes from other areas of a company, such as management or human resources.
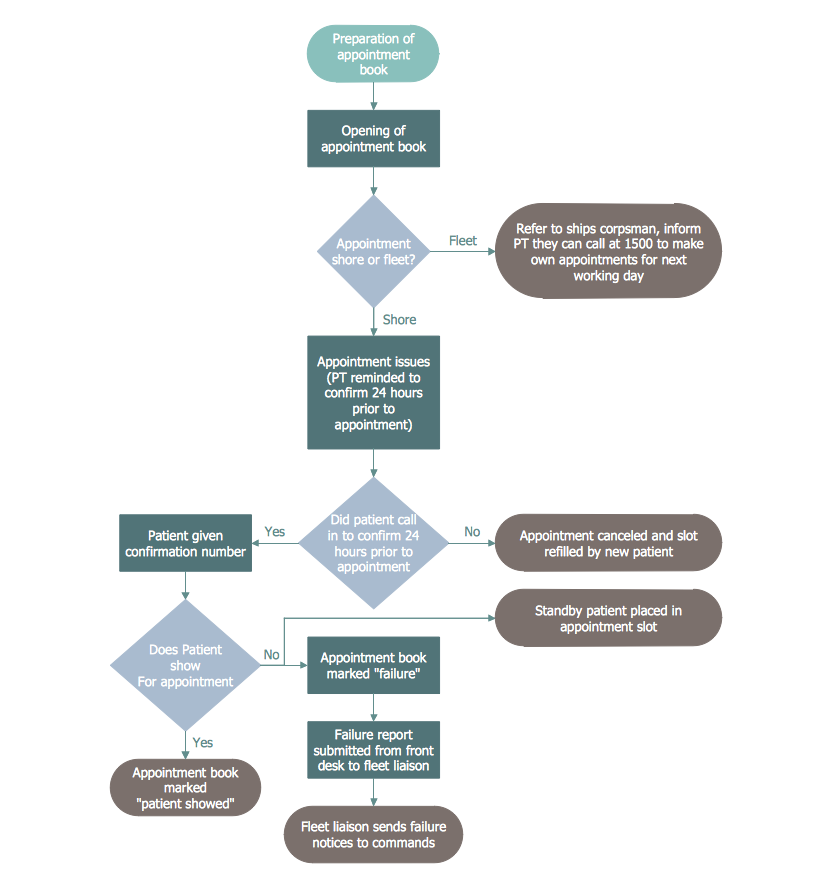
Flowcharts show repeated processes, like this sequence of doctor appointment procedure
- Swimlane diagrams — If a business process crosses over multiple departments, in can be easier to define using a flowchart that has been divided into distinct sections, or 'swimlanes'. These lanes distinguish which persons, groups, or location influence a particular step of the business process. They are useful for explicitly stating each stakeholders responsibility, and the actions each employee is expected to complete, before the process can continue to the next department. Other terms for these type of diagrams include 'deployment flowchart' and 'cross-functional flowchart'.
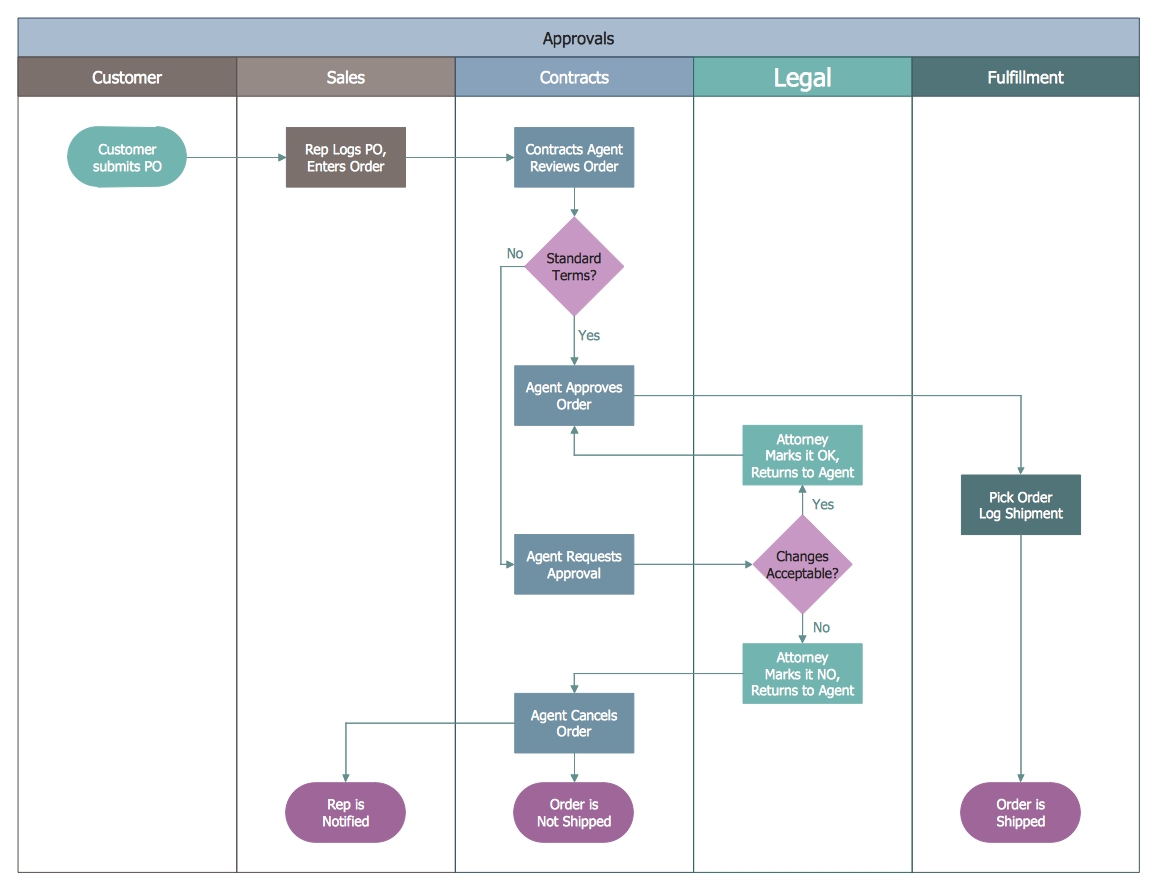
This swimlane diagram was created using ConceptDraw PRO, and shows the steps that each division is responsible for in a customer order
- IDEF3 — The IDEF business process modelling language is used in slightly more specific scenarios than the previous examples. IDEF3 in particular is a scenario-driven description capture method, that has the ability to define the state of the same system or process under a variety of conditions. While flowcharts can allow a certain amount of artistic license in their design, IDEF3 uses standardized process schematic symbols — a more complex and comprehensive set of icons than found in flowcharts, and more precise in their definition.
- Value stream mapping — A value stream map takes a wide look at the relationships between manufacturing, production control and shipping processes. They follow the value chain through an organization, from supply until it reaches the market. Like IDEF3, standardized notation is used to facilitate understanding between workers and workforces.
No comments:
Post a Comment