A flowchart can take any process and distil it into a series of actions or decisions; it is a versatile and simple form of diagram that can be used to describe situations in any field, and is easily understood by everyone. They are used frequently in business to document workflows from all areas of a company - they can show accounting purchase orders, human resource recruitment strategy, or a product life cycle.
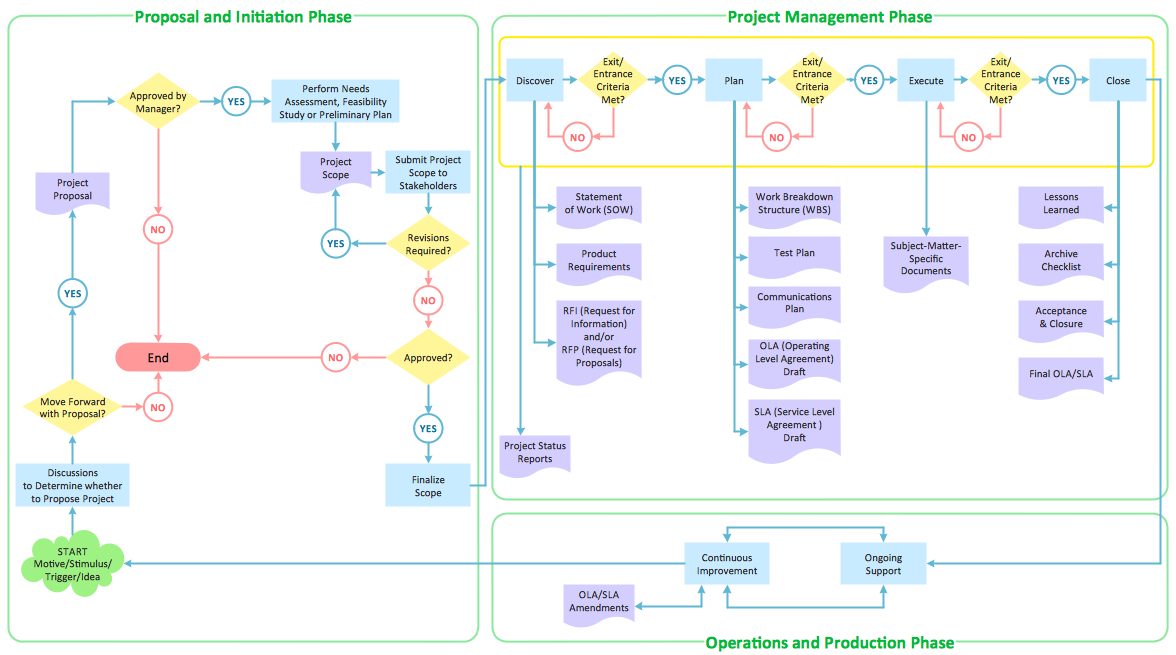
Fig 1. Flowchart — Product life cycle process
What makes a flowchart so widely used and readily understood is the use of standardized symbols that retain the same meaning whatever process they are describing. They always start and end with a Terminal, an oval shape containing the appropriate text. A diamond shows that a Decision is necessary, often yes/no or true/false, while an Action is shown as a rectangle, containing text describing what happens. Other flowcharting symbols add contextual layers to specific process flow diagrams, with icons that represent punch card inputs, disk storage, and manual operations.
As more of business has become reliant on computer systems, there has been a need to use flowcharting to map data flow diagrams. Symbols known as data-flow extensions exist for this exact function, that allow Documents, Manual operations, Manual inputs, and Data files to be added to a data flow chart.

Fig 2. Flowcharts design elements
With these building blocks, it is possible to create flowcharts that describe work process flows from all divisions of a company. Different types of process flow diagrams exist to reflect the different ways in which data and resources interact within each area of a business. Here are some examples of the types of flow diagrams in common use:
- Data-flow diagrams — these diagrams can show the interaction between a system and external agents, or show the flow of data within that system. They are used to visualize how a system will operate, how it can be implemented, and what effect data input will have on the system as a whole.
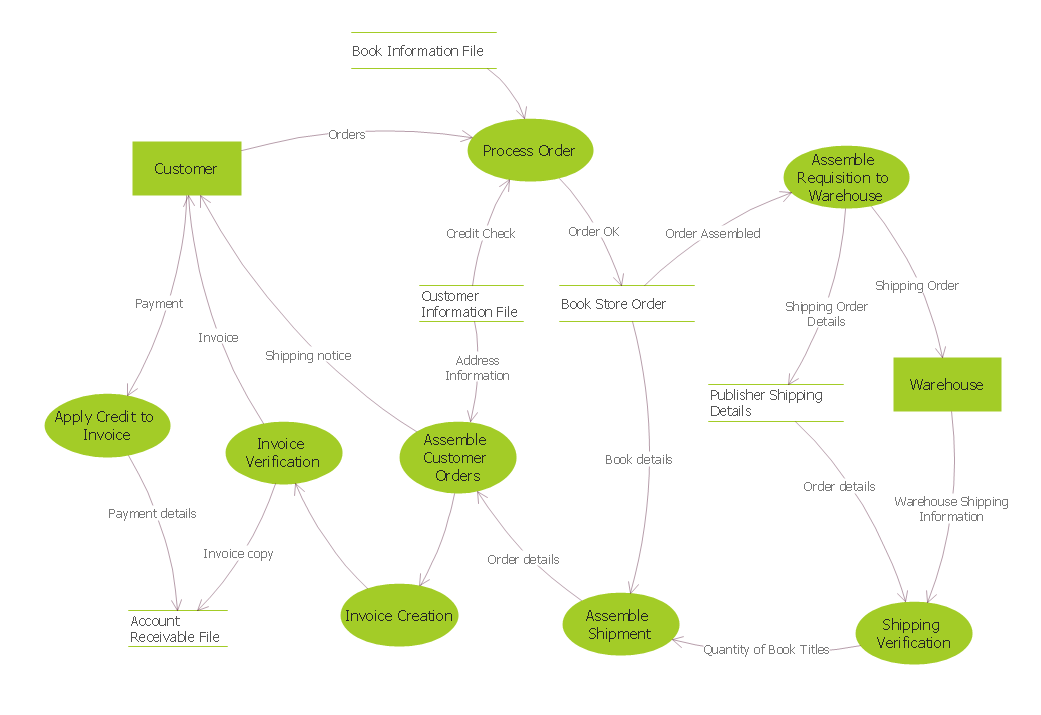
Fig 3. DFD Process of account receivable
- Functional flow diagrams — these are used to map a multi-tiered, time sequenced process. They show a workflow as a series of levels, with each step of the top level process expanded into it's own list of functions that represent the 2nd tier of the process. This can be repeated for as many tiers as is necessary.
- Algorithm charts — the binary nature of decision making on a process flowchart means they are an ideal medium for mapping computer algorithms. The flowchart symbols are used to graphically represent a step-by-step set of operations to be performed, and the rules by which they are defined.
- Activity diagrams — this type of diagram is used extensively as an example of Unified Modeling Language, used by software engineers as a standard way of visualizing the design of a system. Activity diagrams differ from normal flowcharts primarily by being able to show the start and end of concurrent activities, using a specific Join or Split symbol.
- Cross-functional flowcharts — this type of flowchart is constructed as a matrix, arranged into 'swimlanes' that denote different stakeholders or departments. It shows each individuals activities, and how the work flow crosses departments to form a complete process.

Fig 4. Swimlane Process Mapping Diagram — Payroll Process
Flowchart solutions from ConceptDraw
For years ConceptDraw has been delivering high quality business process flow design solutions, turning ConceptDraw PRO into one of the most comprehensive and powerful examples of flowcharting software available. Solutions have been tailor made to apply to numerous departments and stakeholders within a company, while ConceptDraw specialize in professionally drawn vector stencil graphics of both standardized flowchart notation, as well as a large selection of themed icons and design elements.
Here are some of the flowcharting solutions for ConceptDraw PRO, and examples of process flow charts that have been created using them:
- HR Flowcharts — libraries of icons relating to human resources allow HR staff to illustrate workflows in that field, such as the recruitment process, staff training, or health and safety initiatives.

Fig 5. Human Resource Development — Onboarding Model
- Accounting Flowcharts — the set of symbols found in this solution give accountants the tools they need to describe purchase orders, payments, or procurement processes.
- Sales Flowcharts — Sales workflows can cover interaction between customer and business, or an internal sales process needed to be performed by workers.

Fig 6. Sales Flowchart — Global Payment Solutions
- Audit Flowcharts — this solution contains extra symbols to help illustrate the steps needed to prepare and implement the audit process.
- Cross-Functional Flowcharts — As mentioned previously, this type of flowchart drawing is divided into 'swimlanes'. It needs special notation to signify the relationship between these divisions, which can be found in this solution.
- Business Process Diagram — this solution contains design elements for Business Process Model Notation (BPMN) v2, which is an extension of the standard flowchart notation, and allows users to present complex process semantics and more precise information for any given step.

Fig 7. BPMN 2.0 — diagram logistics
- IDEF0 Diagrams — IDEF0 is the modeling language used to create flowcharts specifically for the analysis of computer system software, or software engineering. This solution from ConceptDraw contains the necessary connecting arrows and callouts.
- Flowcharts — the base flowchart solution for ConceptDraw PRO has a large library of all common flowcharting symbols.
These are just some of the vast array of online business process diagramming solutions that can be found in ConceptDraw Solution Park, on the ConceptDraw website. By using flowcharts, you can map unique company processes at all levels and across all departments, transmit information to important stakeholders, or use your flowchart as part of a presentation - so it is important to have a piece of software powerful and dynamic enough to cater for all flowcharting needs. Combining these solutions with ConceptDraw PRO gives users all the tools they need to create effective and professional flowchart designs.
No comments:
Post a Comment